

Today, only 5% -15% of Facebook video ad concepts are successful. So, as many as 85% – 90% of creative doesn’t beat the highest-performing ad, the control ad. If you take media spend away from the best ad to run against the 2nd or 3rd best ad, you lose money. Is there some sort of magic formula, though, to deliver a larger percentage of winning creative to achieve a successful creative rate?
Most likely, the answer is no, unless you get lucky. If you do uncover a winning ad concept, your luck will run out as your high-performing creative fatigues over time. But, there may be a moonshot path to increasing the overall win rate for creative testing with in-app purchase (IAP) titles. The key to increased ‘winning’ creative is through mid-funnel conversion goals and correlation modeling suggesting a First-Purchase CPA or level event that corresponds well to purchase behavior. Find out why here.
High-Velocity Creative Testing
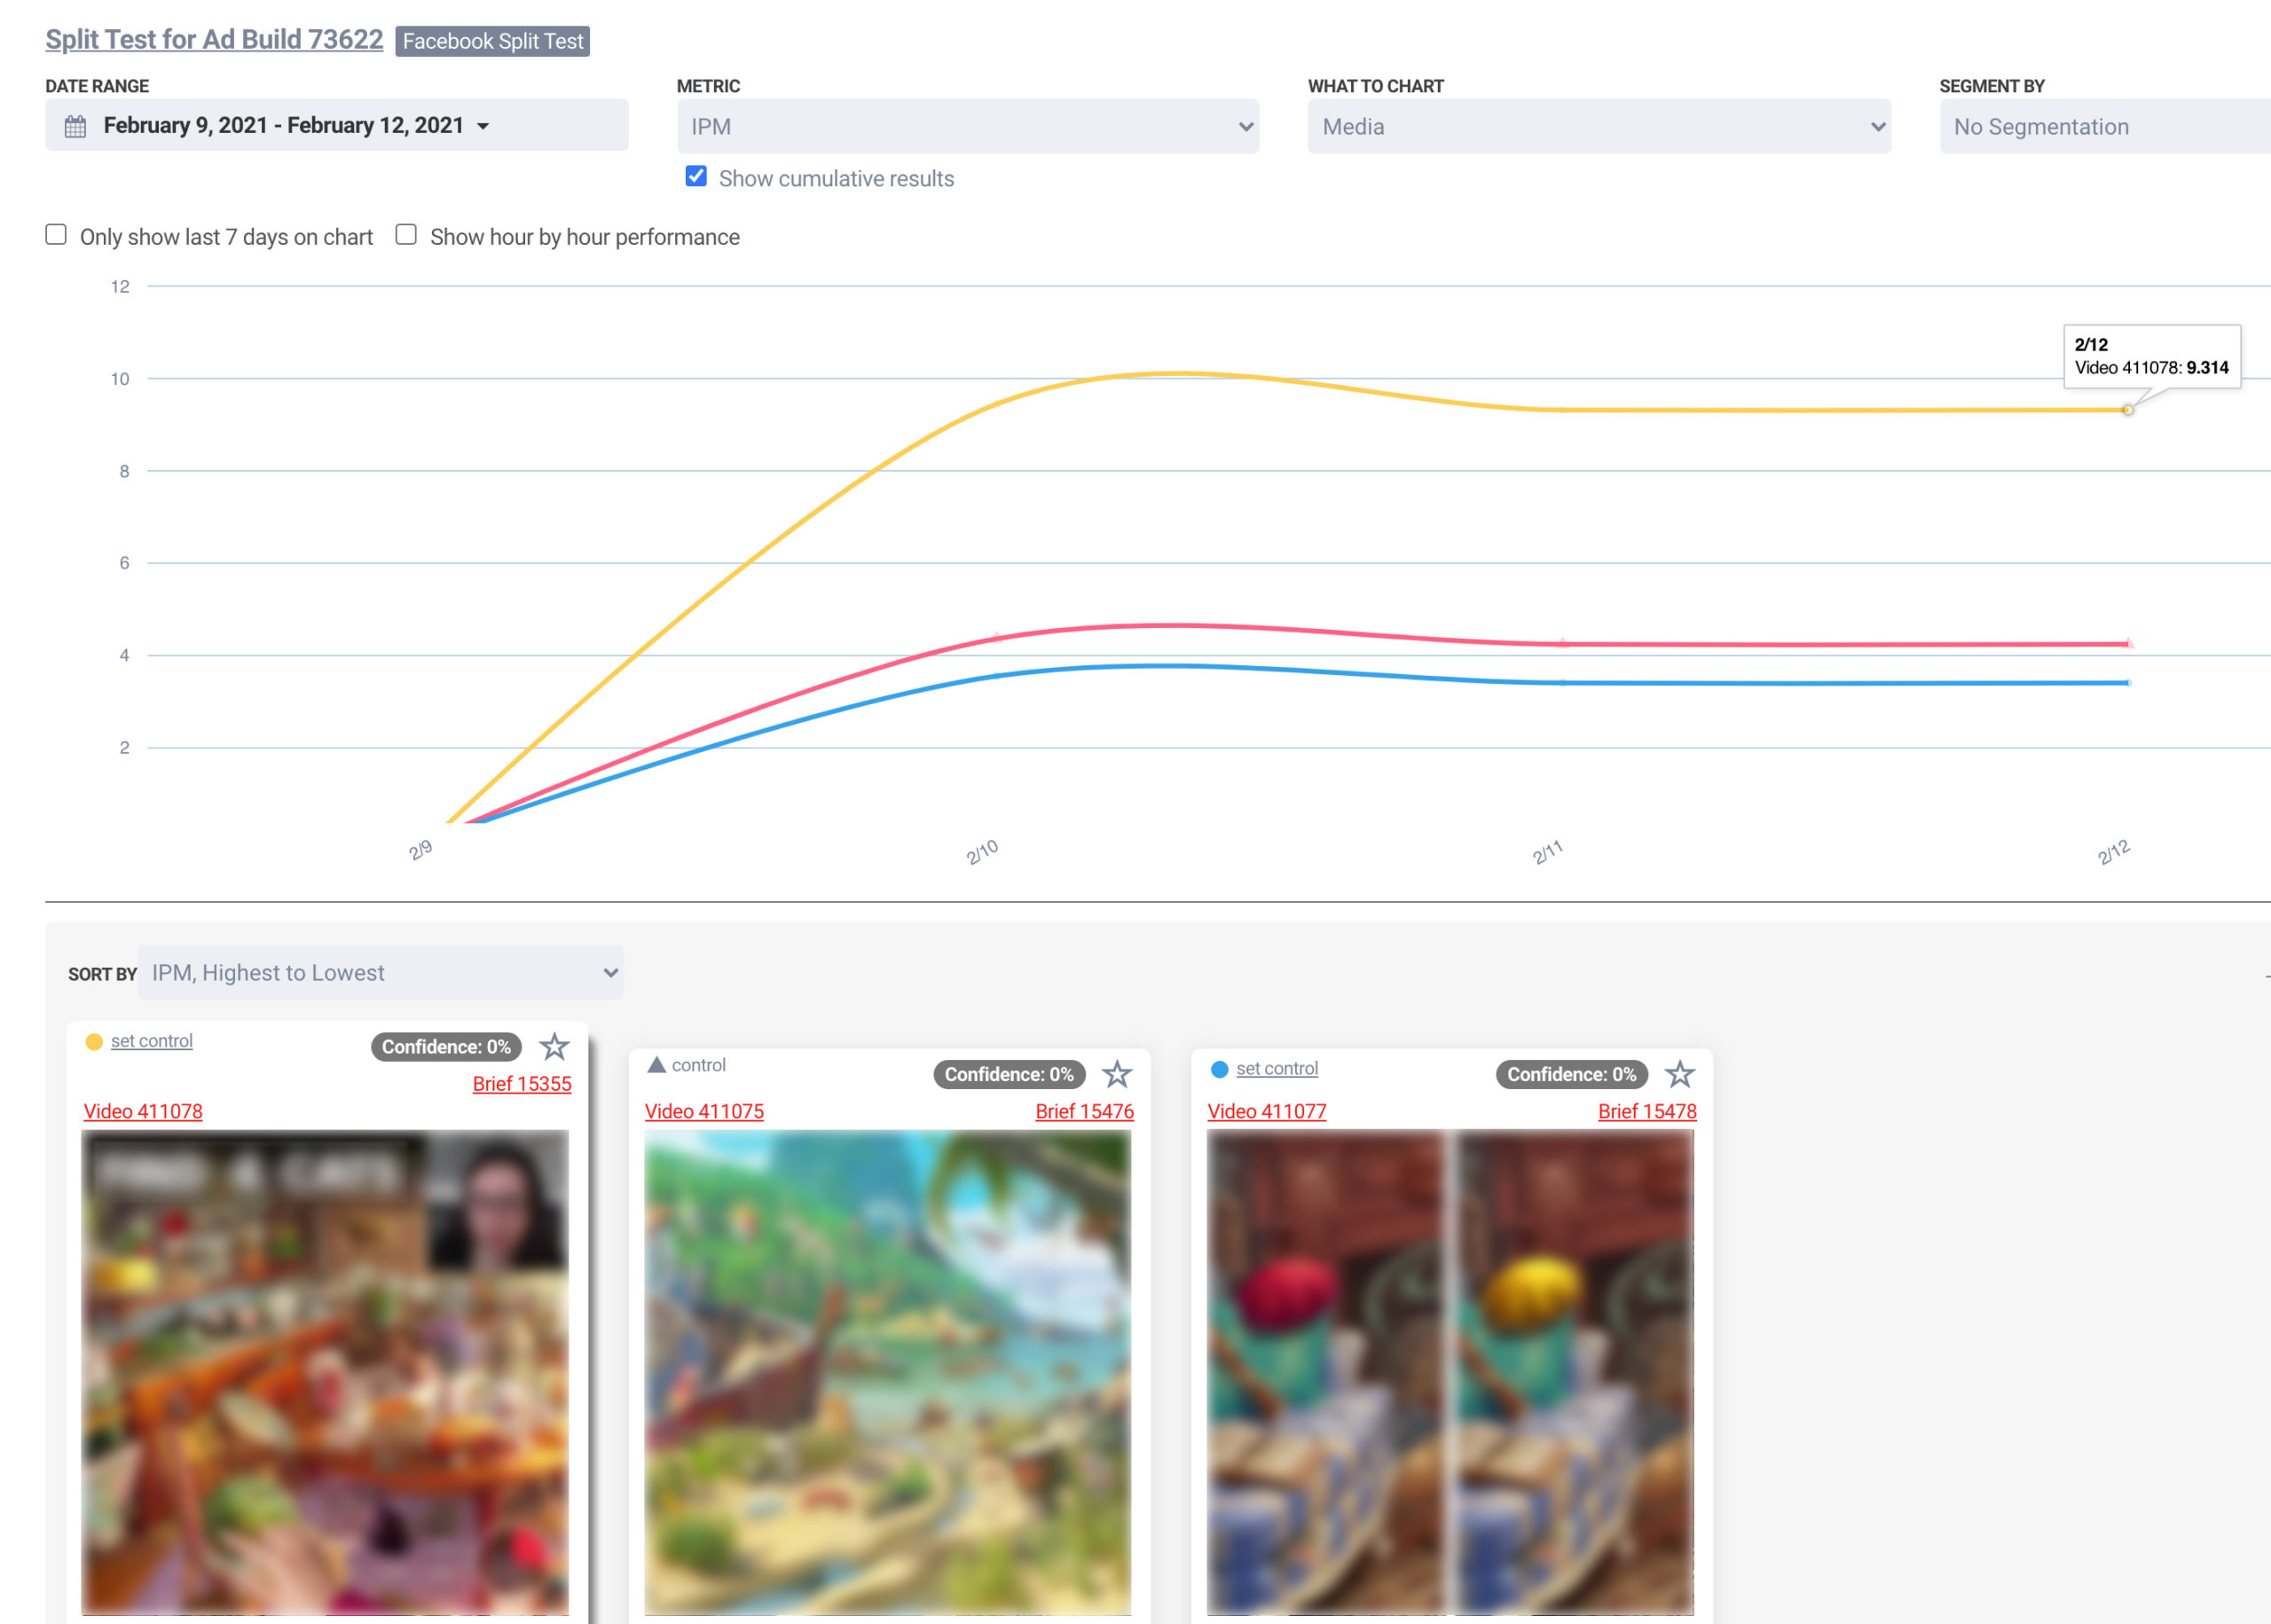
First, let’s focus on current A/B testing best practices. We’ve found success and consistency with high-velocity creative testing through qualification stages. High-velocity creative testing also referred to as high-tempo testing, requires rapid testing and experimentation to yield major growth. The principle being, the more you test and the faster you perform these experiments, the sooner you can uncover a new winning concept and then iterate on what’s working.
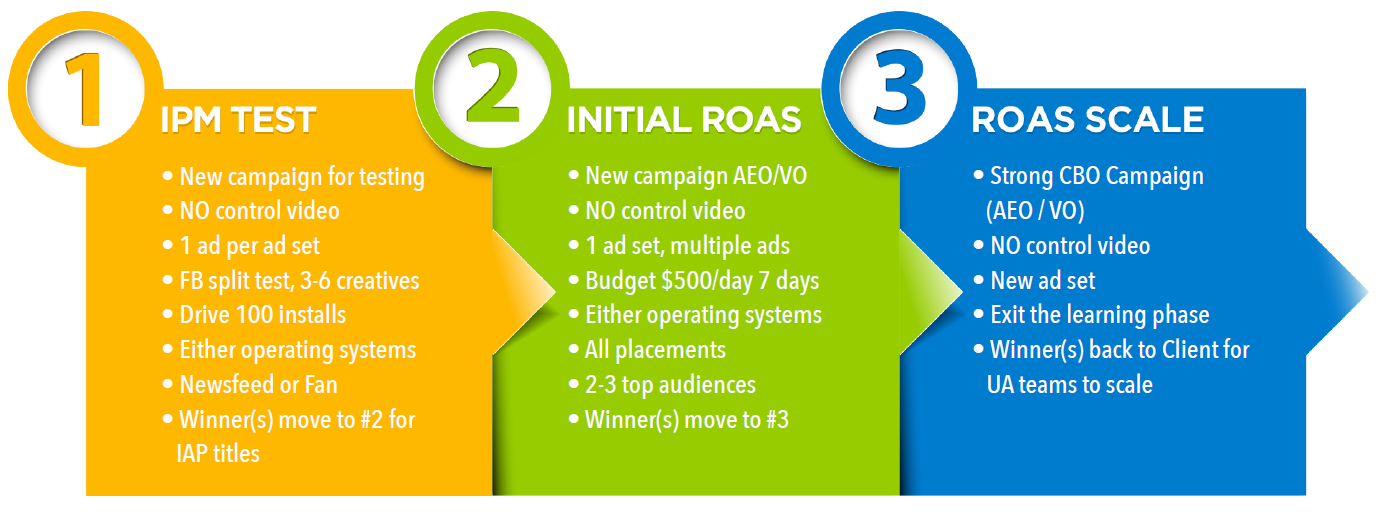
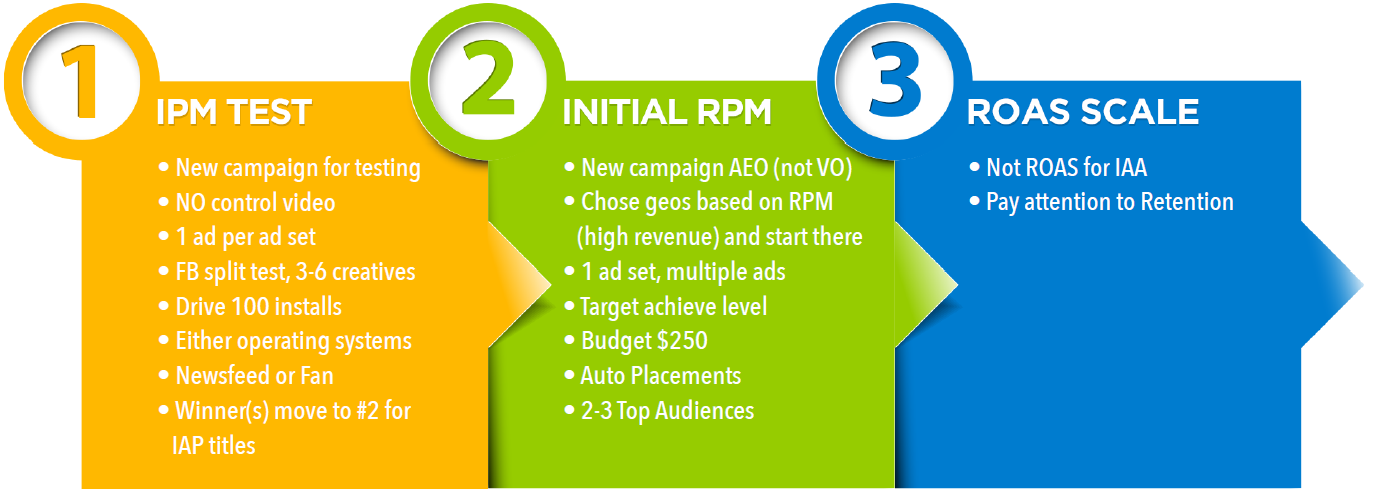
Three-Stage Process
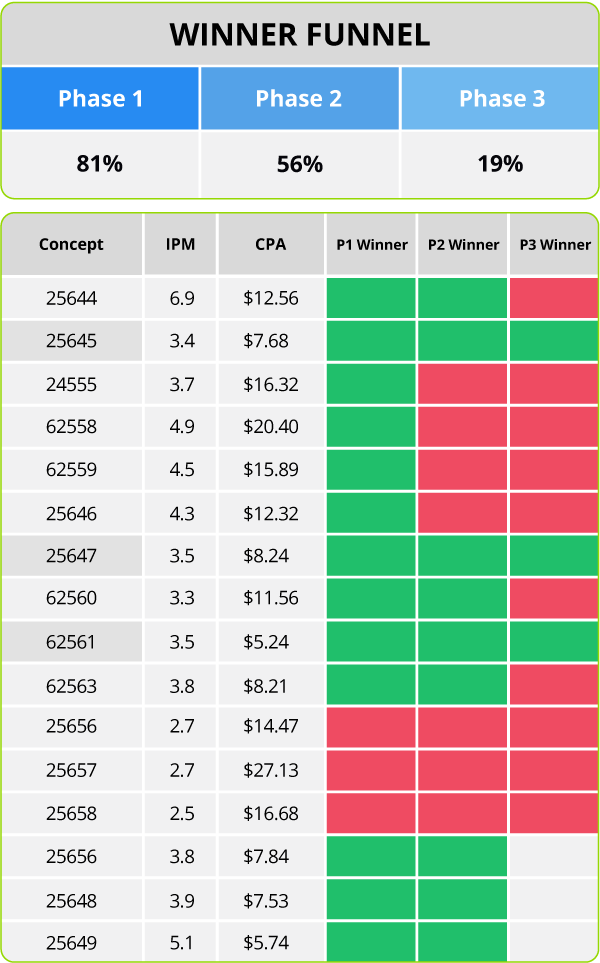
We begin our high-velocity creative testing in cost-effective economical geo like the Philippines or India. During Stage 1, we vet creative for higher install per impression (IPM). Next, Stage 2 requires we take the high-IPM winners from Stage 1 and create a separate campaign to monitor KPI targets like return on ad spend (ROAS). Finally, Stage 3 pits assets winnowed from the initial stages against historical winners (control). This process on average yields a 15% win rate across many gaming and eComm apps. And, app advertisers also waste less of their budget by not having to spend 85% on running ‘losing’ creative out to statistical significance. Yes, this process can generate false winners and false losers, but you are likely to spend $200 to $2K on testing to discover ads that reach the standard successful creative rate vs $20K.
The Impact of IDFA Loss
Unfortunately, the impact of Apple’s IDFA loss will cause ramifications for high-velocity creative testing. We discuss the devastating impact it will have on creative A/B testing in this article. So, it may be time to re-imagine creative testing﹘especially when it comes to improving your creative win rate. Again, there are no shortcuts to finding ads that reach the successful creative rate. While creative is king, quality is not a meaningful objective category. Often, assets deemed high-quality fail, while simple concepts become evergreen. This led us to a hypothesis we’re testing…
Mid-Funnel CPA Goals
So, how can we demonstrate value to executives of high-volume creative production? The answer﹘improve the successful creative rate. But, is it possible to attempt this while following a sustainable approach﹘producing less creative or perhaps killing losers faster and spending less on them? For us, we believe one moonshot path is through mid-funnel CPA goals. Currently, we’re using mid-funnel CPA goals to modify the three-phase process to uncover different tiers of targeted KPI winners. These different tiers include:
- Evergreen Scale Drivers
- Mid-Tier Assets that Meet KPI Targets at Lower Scale
- Short-Life Winners that Supplement the Overall Portfolio
In other words, instead of trying to produce more ‘winning’ creative, we’re reevaluating what success looks like. This prevents us from disqualifying ads that previously wouldn’t have been labeled successful.
Step 1
First, track creative assets testing through the current testing framework to establish the current win rate.
Gateways: Engagement A/B test [IPM]> KPI [no champion] > KPI [with champions] > Evergreen [KPI at scale]
Step 2
Next, you need to identify creatives within that 15% that rise to the status of “Evergreen.” What separates a “creative winner” from an Evergreen asset? Scale and endurance. Remember, your campaign will have multiple evergreen assets running at any given time at different stages of their lifecycle. So, new assets must be ready to replace those nearing the end of their lifecycle to sustain the KPI target. Then, map over time the efficiency rise and fall of a successful video. Also, plot the percentage of spend in that timeframe and the number of creative tested.
Key Points:
- For this client, on average an evergreen video sustained $16-20K over a six-week period at KPI, or 13% of overall volume.
Step 3
Finally, you question the methods of the three-phase process for mid-funnel business goals. Is Phase 1 necessary since we’re looking for a mid-funnel event that is nearly as frequent as install? Besides, we’re already limited to running Phase 1 in a T1 country (UK), so can we possibly augment Phase 1? Instead, we start with Phase 2 without performing an a/b/c test. Also, we make criteria for live campaigns at a spend threshold / CPA minimum and IPM minimum. Then, we graduate these winning assets to Phase 3, pause them in P2 group, and continue their testing in P2. Ideally, with a direct line to KPI, fewer assets will have CPA efficiency. But, lower IPM ones will be disqualified, yielding more potential winners.
Google UAC
Again, the loss of Apple’s IDFA has a cascade of consequences. One of the ramifications will be how creative is used on Google. If you are running an asset feed ad like Google UAC, you need enough creative combos within the feed to be truly effective. We believe a related chart will be necessary for Facebook AAA for an iOS14 account.
Creative Fatigue
Unfortunately, creative fatigue is very real. Facebook, Google, etc. ads do have a shelf-life, even if they reach “evergreen” status. (Understandably, this may be confusing. Evergreen suggests the content can exist throughout the year. But, every asset reaches a point of diminishing return.) So, how can you recognize when creative fatigue will set in before you see a significant drop-off in performance? And, are all platforms created equally when it comes to the staying power of winning content? Stay tuned for a future article where we give you the definitive guide on how to combat creative fatigue.
IAA Apps vs IAP Apps
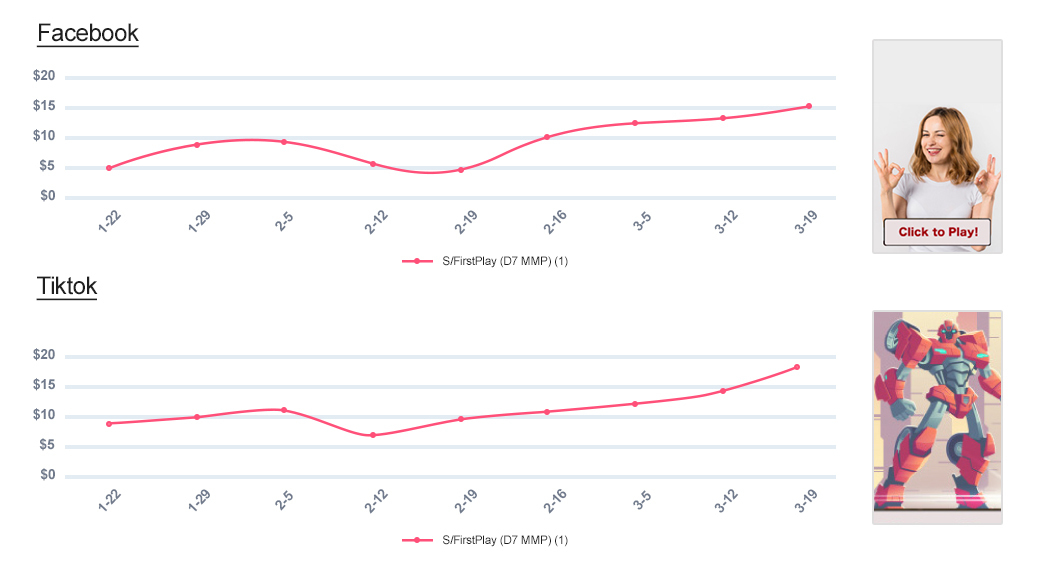
Also, does creative fatigue affect IAA apps and IAP apps differently? Sadly, yes. The good news is, we have proven UA strategies that address both app types. Here’s how you can surpass the standard 15% successful creative rate on Facebook and TikTok.
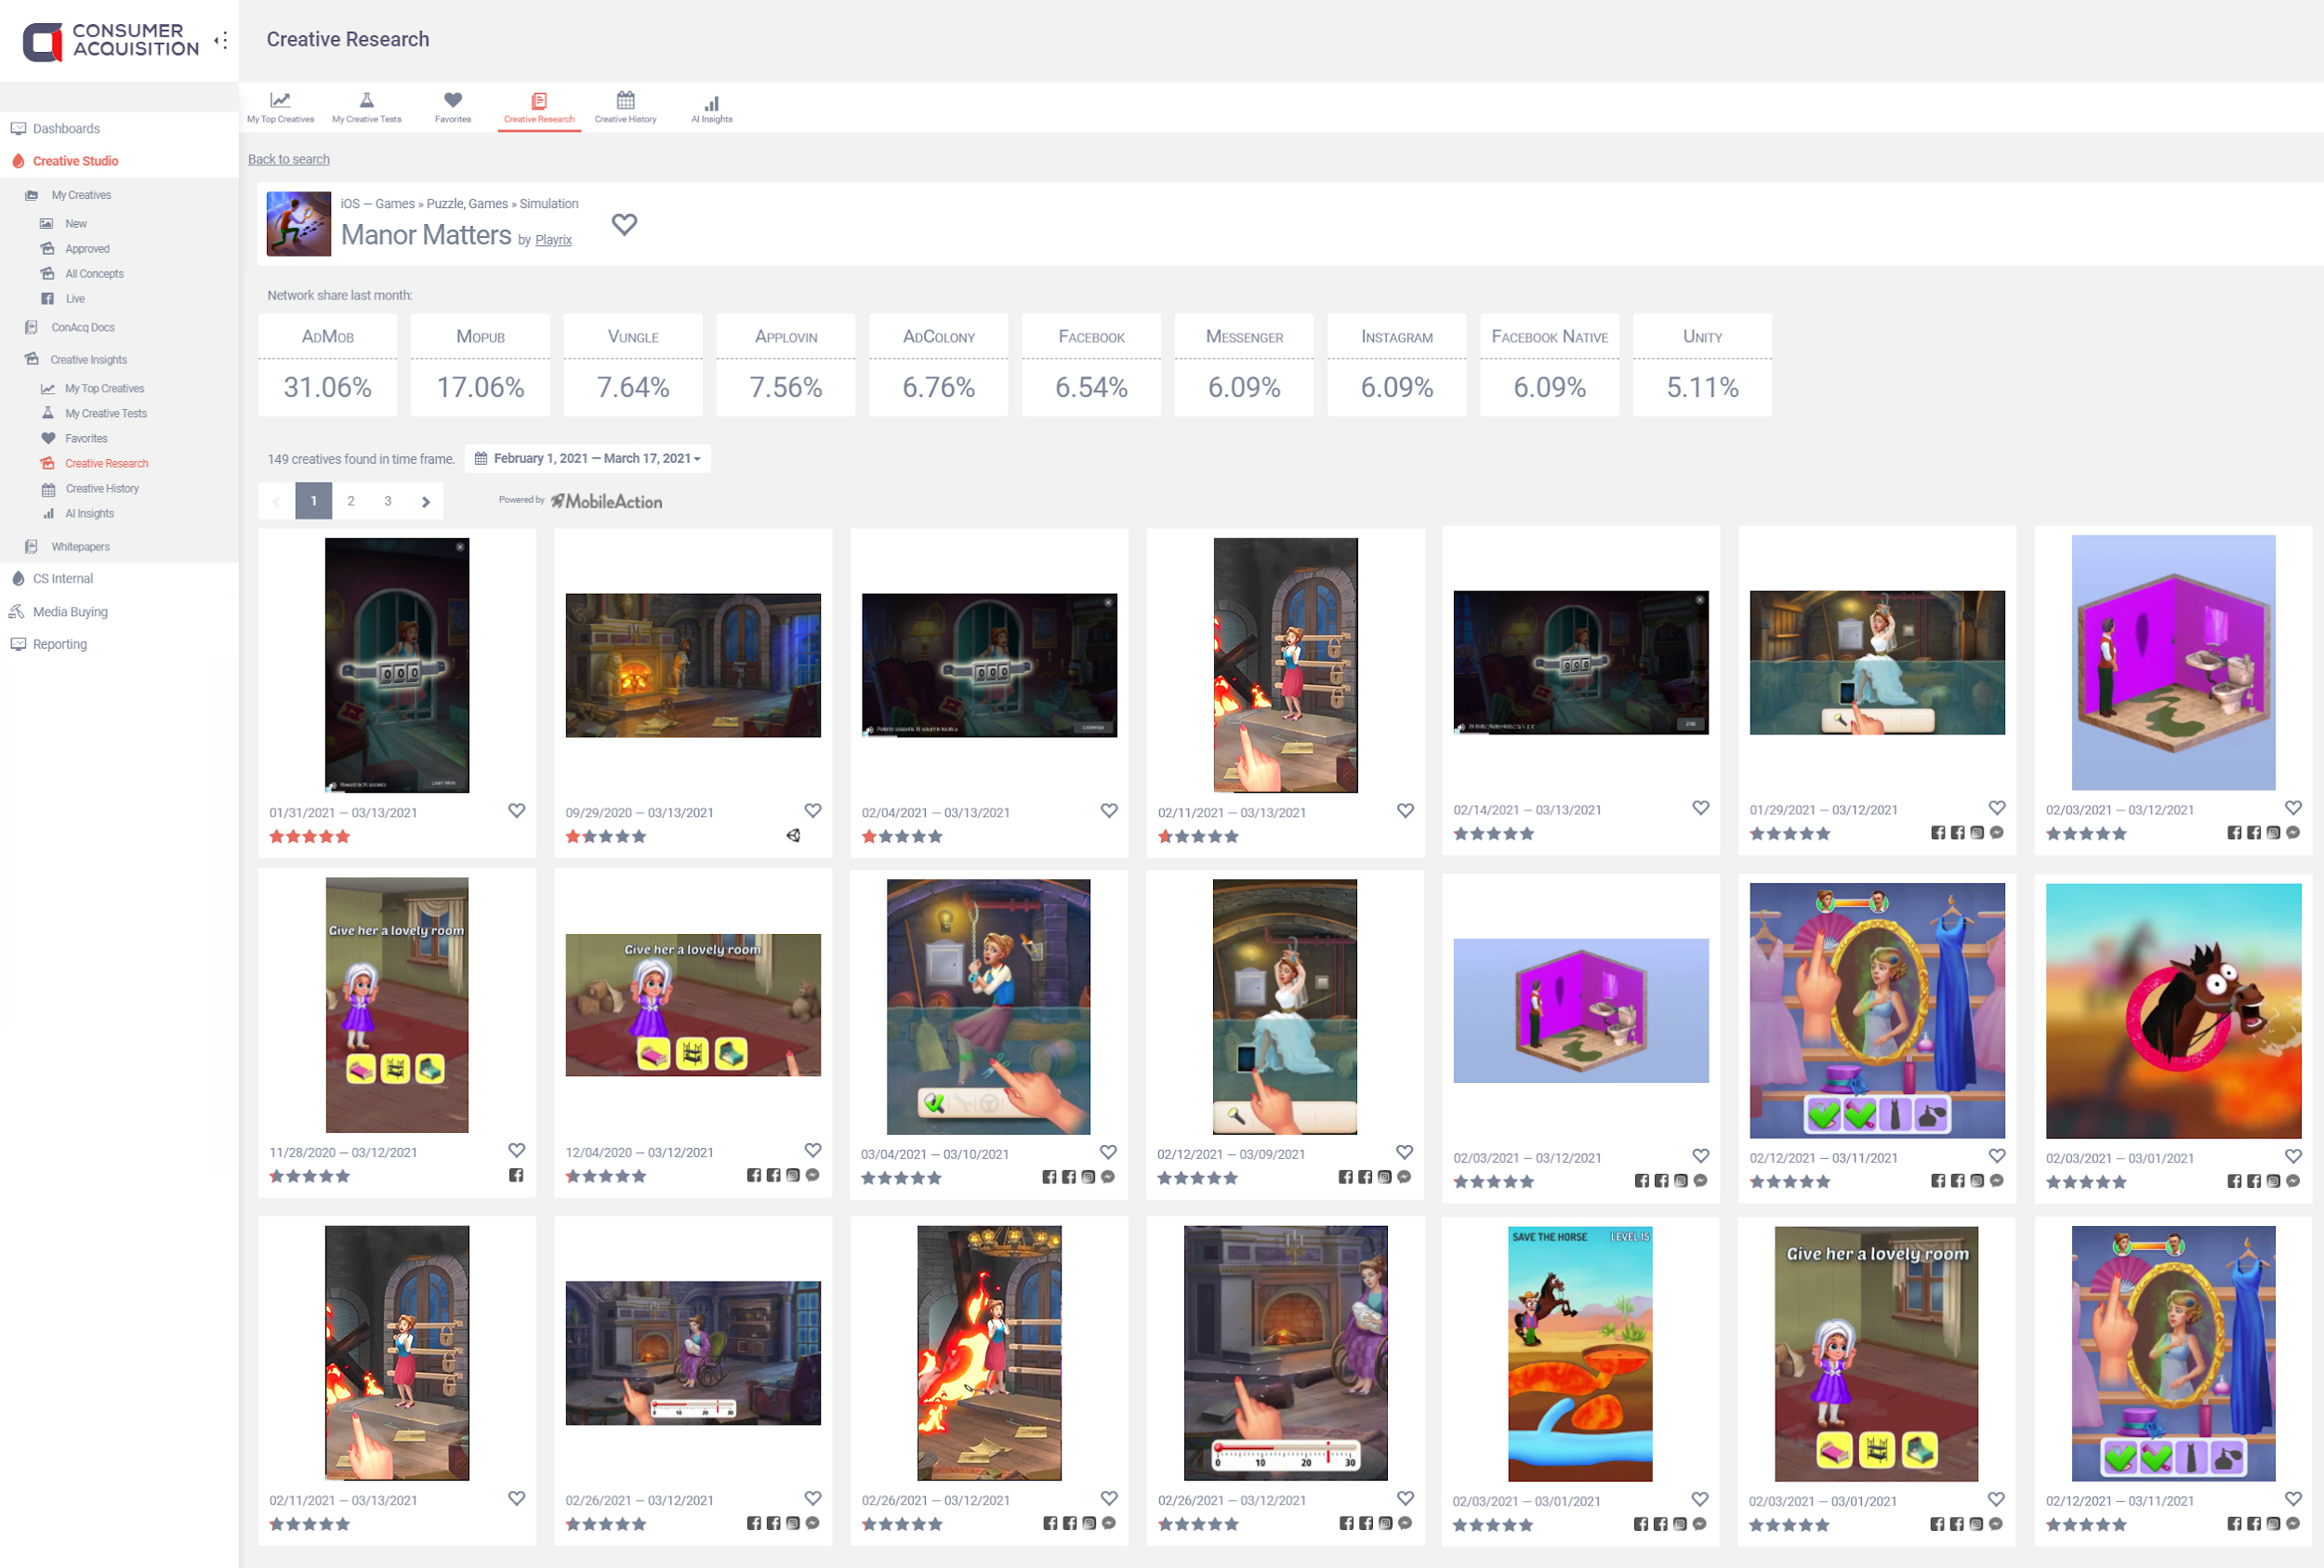
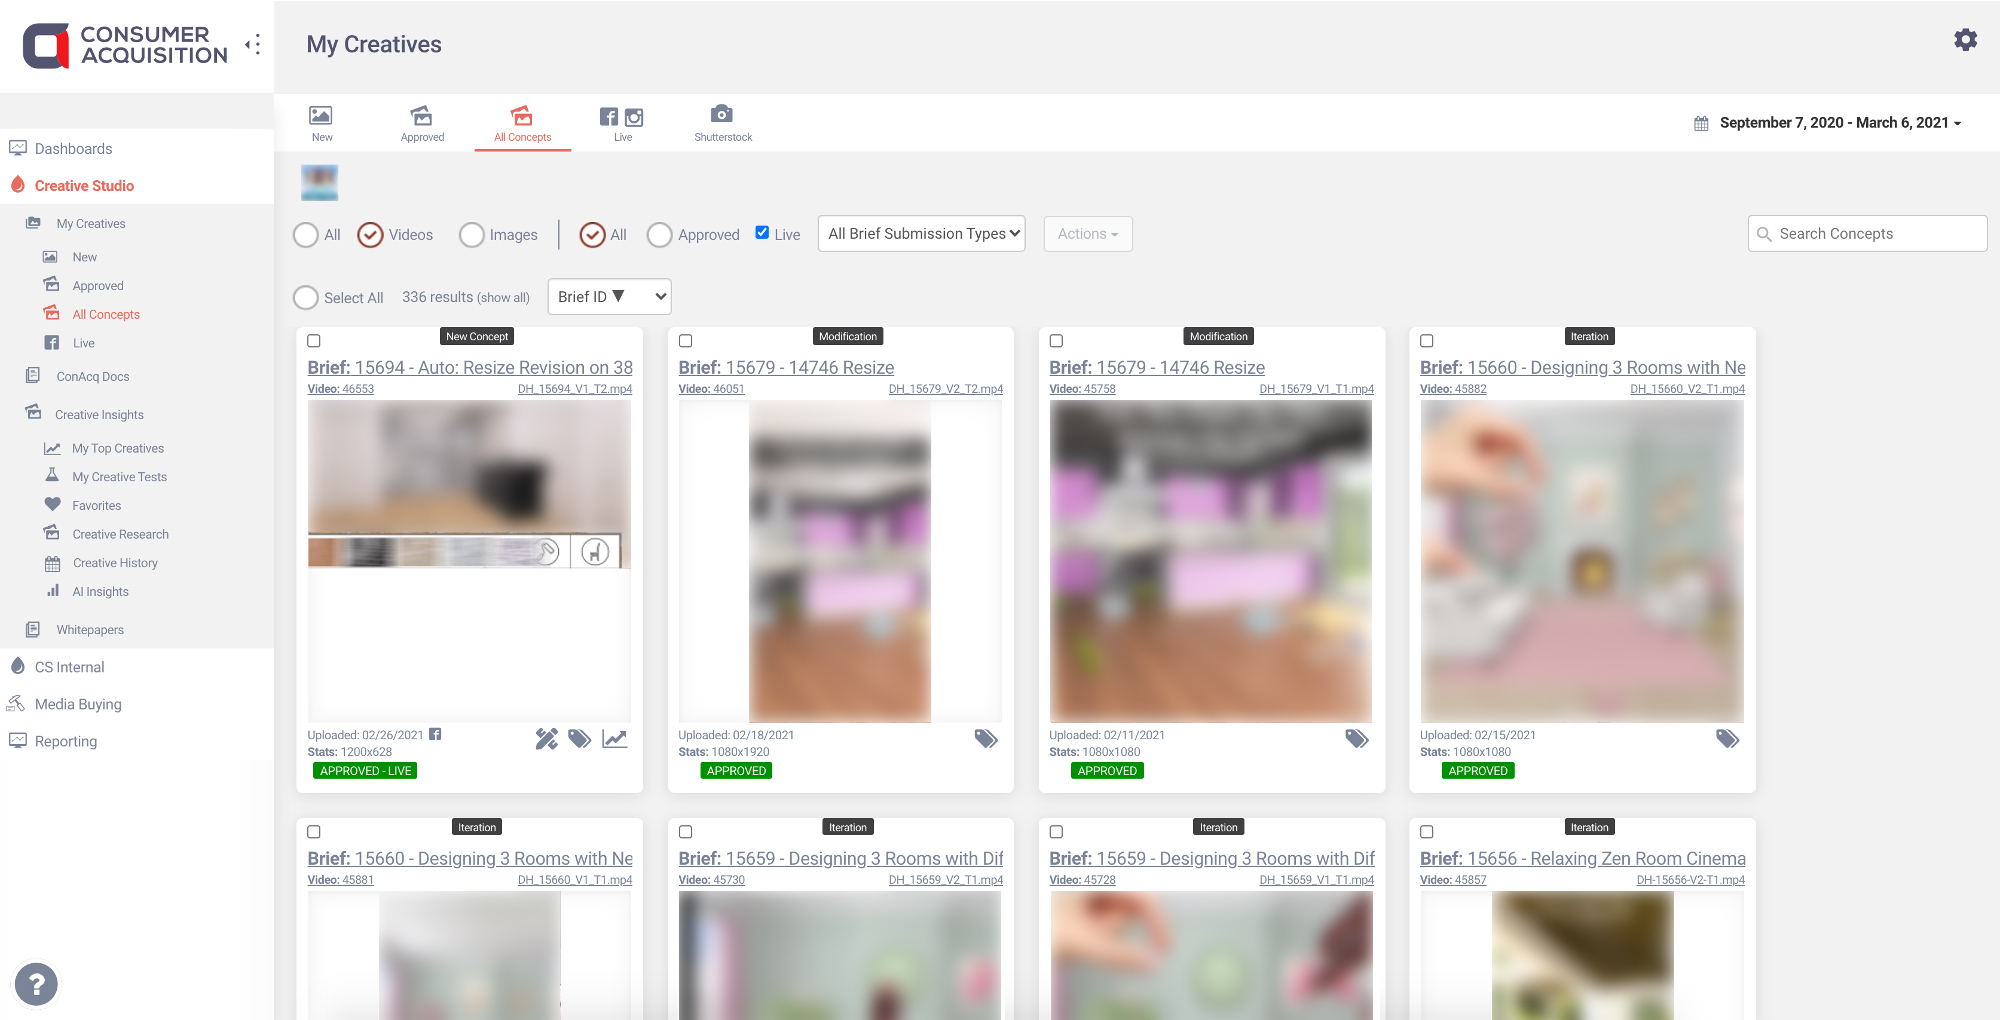
How We Can Help Achieve a Successful Creative Rate
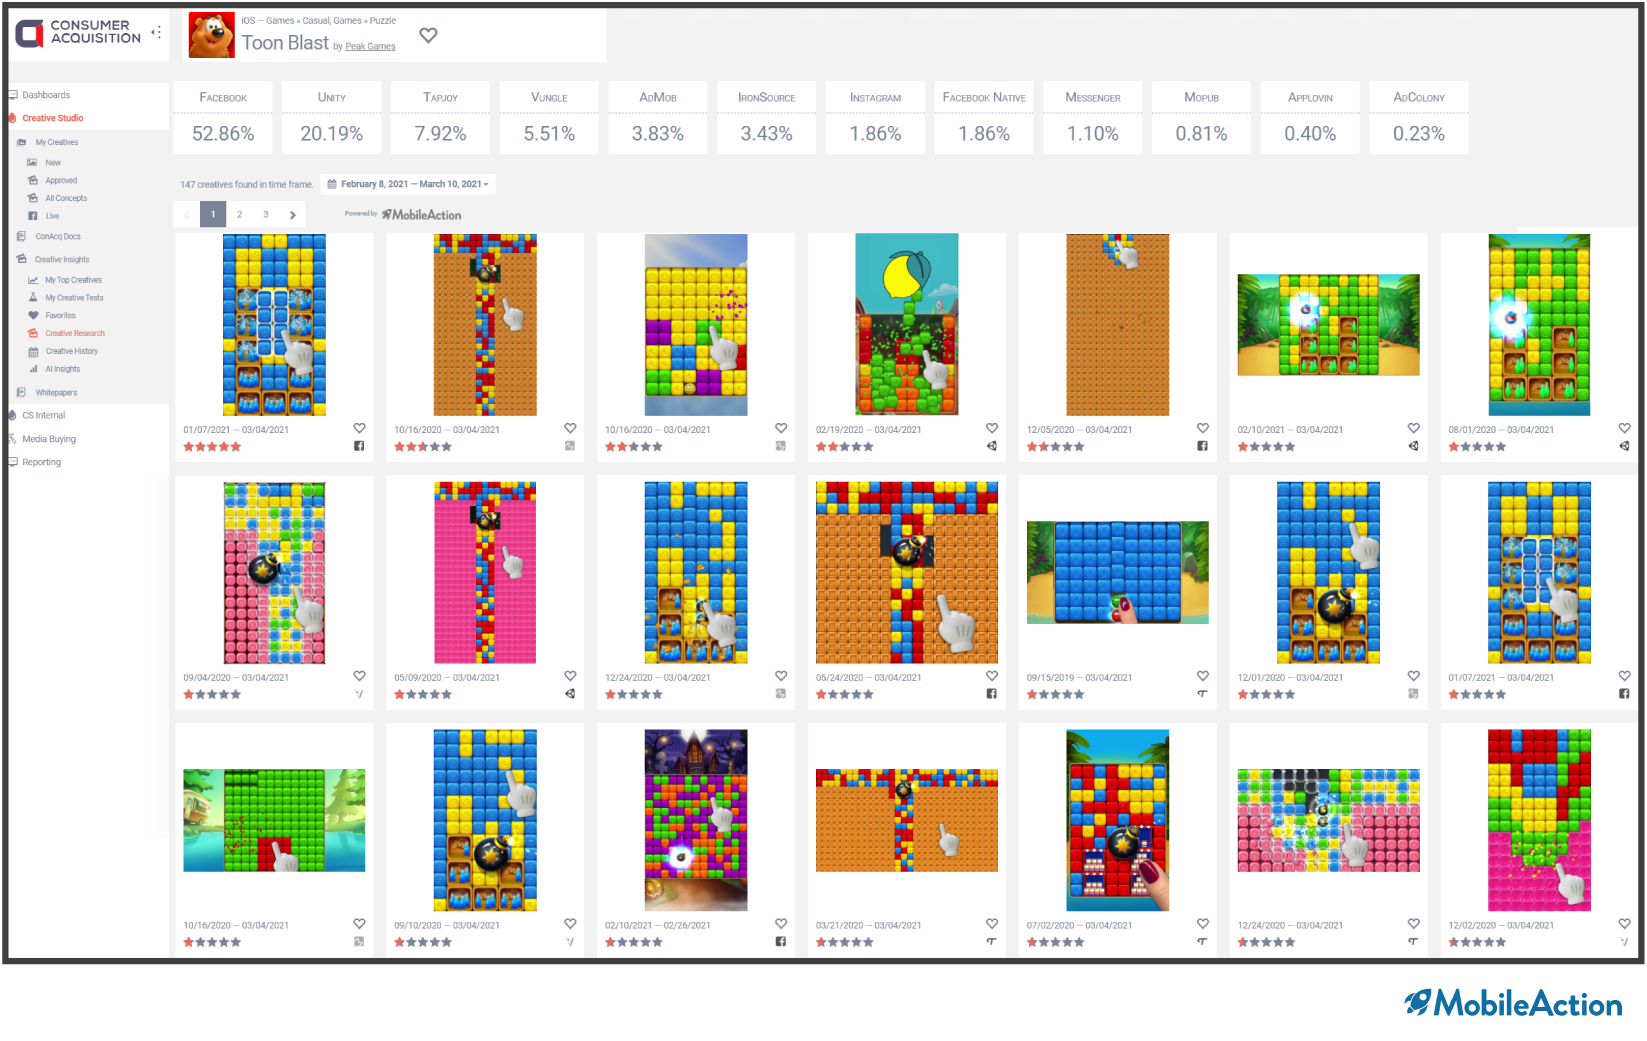
Our Creative Studio provides breakthrough creative ideas for the $150+ million in monthly spend. Consumer Acquisition boasts an elite Hollywood storytelling creative team with vast animation and social advertising experience. Our creative strategy and competitive analysis unlock original concepts that make Facebook, Google, Tiktok, and Snap advertising profitable. And, we’re offering a $5,000 flat rate for A/B media buying testing that can be added to our Creative Studio services. So, please reach out to Sales@ConsumerAcquisition.com if you would like to get creative driven by performance.